Oracle 19c comes with several powerful features and tools for performance tuning, allowing administrators and developers to improve database performance, handle high loads, and manage concurrency effectively.
One of the key aspects is to keep monitoring the system on a regular basis and setup adequate alerting systems to warn you on issues. I will not cover database design here hoping that has been taken care at the start of development cycle. The best technology in the market and best possible tuning won’t help if db is poorly designed so understand data, growth and system at the start.
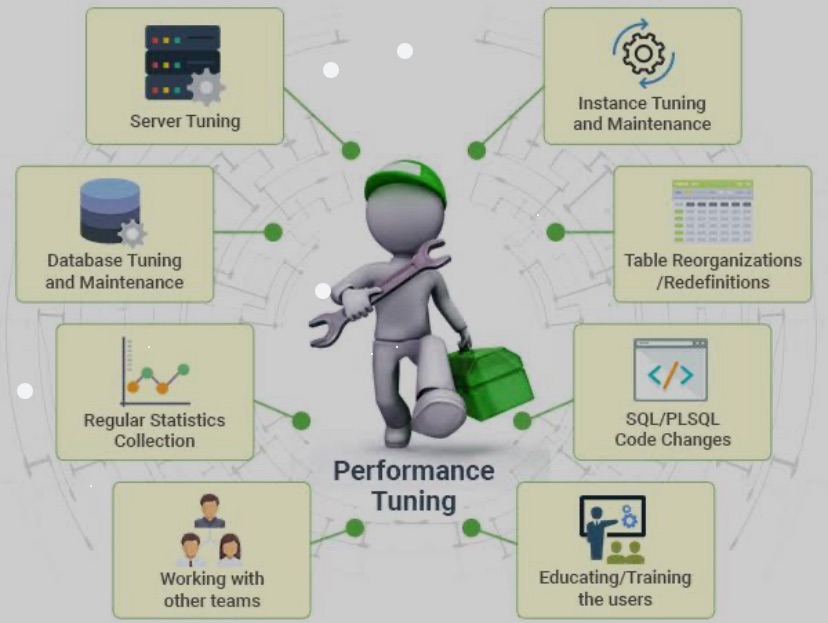
Below are some performance tuning tips, tools, and commands, along with examples for Oracle 19c.
Use Automatic Database Diagnostic Monitor (ADDM)
• ADDM analyzes database performance and provides recommendations.
• To run an ADDM analysis:
EXEC DBMS_ADDM.ANALYZE_DB();
Review findings in Oracle Enterprise Manager (OEM) or using DBA_ADVISOR_RECOMMENDATIONS.
b. Optimize Memory Usage
• Oracle uses Automatic Memory Management (AMM), but manual fine-tuning can still improve performance.
• Adjust SGA (System Global Area) and PGA (Program Global Area) sizes based on workload.
For example, if PGA is under-allocated, performance may suffer under heavy load:
ALTER SYSTEM SET pga_aggregate_target=2G SCOPE=BOTH;
ALTER SYSTEM SET sga_target=4G SCOPE=BOTH;
c. Optimize SQL Queries
• Identify slow queries using the Automatic Workload Repository (AWR) reports.
EXEC DBMS_WORKLOAD_REPOSITORY.create_snapshot();
Run the SQL Tuning Advisor to generate recommendations for slow SQL queries:
EXEC DBMS_SQLTUNE.CREATE_TUNING_TASK(sql_text => ‘SELECT …’, user_name => ‘SCOTT’);
EXEC DBMS_SQLTUNE.EXECUTE_TUNING_TASK(‘TASK_NAME’);
AWR reports comes very handy for poorly performing queries so think about automating schedule to run this report and study it frequently. You can take help from any AI engine to review it for you and send you notification if there is a problem.
d. Indexes and Partitions
• Use B-tree or Bitmap indexes for faster query execution. Evaluate the need for creating indexes on frequently queried columns.
CREATE INDEX idx_emp_name ON employees (emp_name);
• Partition large tables to improve data retrieval efficiency.
CREATE TABLE sales_partitioned
( sales_id NUMBER, sale_date DATE, amount NUMBER )
PARTITION BY RANGE (sale_date)
( PARTITION p1 VALUES LESS THAN (TO_DATE(’01-JAN-2020′,’DD-MON-YYYY’)),
PARTITION p2 VALUES LESS THAN (TO_DATE(’01-JAN-2021′,’DD-MON-YYYY’))
);
Creating index’s May hamper data load performance so pick your indexes wisely.
e. Use Parallelism
• Enable parallel query execution to improve performance for large data sets.
ALTER TABLE sales ENABLE PARALLEL DML;
SELECT /*+ PARALLEL(sales, 4) */ * FROM sales;
f. Tune Redo Log and Undo Settings
• Optimize redo log sizes and set appropriate UNDO_RETENTION for transactions, especially under high concurrency.
ALTER SYSTEM SET log_buffer=10485760 SCOPE=MEMORY; — Increase log buffer size
ALTER SYSTEM SET undo_retention = 3600 SCOPE=BOTH; — Increase undo retention
g. Avoid Full Table Scans
• Full table scans can slow down performance. Use indexes and tune queries to avoid them.
• Use EXPLAIN PLAN to check query execution paths.
EXPLAIN PLAN FOR SELECT * FROM employees WHERE emp_id = 123;
SELECT * FROM TABLE(DBMS_XPLAN.DISPLAY());
h. Bind Variables
• Use bind variables to avoid hard parsing and improve performance, especially for frequently executed queries:
SELECT * FROM employees WHERE emp_name = :name;
Concurrency and Load Handling
a. Connection Pooling
• Use Oracle’s Database Resident Connection Pooling (DRCP) for managing a high number of concurrent database connections efficiently.
EXEC DBMS_CONNECTION_POOL.START_POOL();
ALTER SYSTEM SET connection_pool = true;
b. Latch and Lock Tuning
• Monitor contention for latches and locks using views like V$LATCH and V$LOCK.
SELECT * FROM V$LATCH WHERE name LIKE ‘library cache%’;
SELECT * FROM V$LOCK WHERE block > 0;
• Reduce row-level locking contention by making updates more efficient or adjusting application logic.
c. Use Oracle RAC for Scalability
• For very high loads, consider deploying Oracle’s Real Application Clusters (RAC) to distribute the load across multiple servers.
d. Advanced Queuing (AQ)
• Use Oracle AQ for message queuing in high-load environments to improve concurrency without overwhelming the database.
BEGIN
DBMS_AQADM.CREATE_QUEUE_TABLE(
queue_table => ‘queue_table’,
queue_payload_type => ‘SYS.AQ$_JMS_TEXT_MESSAGE’
);
DBMS_AQADM.CREATE_QUEUE(
queue_name => ‘queue_name’,
queue_table => ‘queue_table’
);
END;
Tools you can use :
Automatic Workload Repository (AWR)
• AWR is Oracle’s performance monitoring and tuning tool that captures detailed performance statistics.
To generate a report:
@?/rdbms/admin/awrrpt.sql
You can review database performance metrics, such as top SQL queries, waits, and more.
SQL Tuning Advisor
• SQL Tuning Advisor analyzes SQL statements and provides recommendations for improving execution plans.
EXEC DBMS_SQLTUNE.CREATE_TUNING_TASK(sql_text => ‘SELECT …’);
EXEC DBMS_SQLTUNE.EXECUTE_TUNING_TASK(‘TASK_NAME’);
ASH (Active Session History) Reports
• ASH collects session activity to diagnose performance bottlenecks.
@?/rdbms/admin/ashrpt.sql
Enterprise Manager (OEM)
• Oracle Enterprise Manager (OEM) provides a graphical interface for monitoring and tuning Oracle databases. It offers a variety of performance metrics and automated tuning advisors.
Statspack
• If you don’t have an AWR license, Statspack is an alternative for capturing performance statistics.
EXEC STATSPACK.SNAP;
Some Commands with Examples
Gathering Optimizer Statistics
• Ensure statistics on tables and indexes are up-to-date for optimal query performance.
EXEC DBMS_STATS.GATHER_TABLE_STATS(‘HR’, ‘EMPLOYEES’);
Tuning Advisor Recommendations
• To apply SQL Tuning Advisor recommendations, use:
EXEC DBMS_SQLTUNE.ACCEPT_SQL_PROFILE(‘TASK_NAME’);
Monitoring Wait Events
• Check for system bottlenecks using wait events in V$SESSION.
SELECT event, count(*) FROM v$session_wait GROUP BY event;
Monitoring Load with AWR Reports
• AWR reports help diagnose issues under heavy load.
@?/rdbms/admin/awrrpt.sql
Summary
To ensure optimal performance in Oracle 19c, it’s essential to use a combination of automatic tools (ADDM, SQL Tuning Advisor), proactive monitoring (AWR, ASH), and manual interventions like adjusting memory, indexing, and query optimization. Managing load and concurrency can be achieved by fine-tuning memory settings, using connection pooling, and leveraging Oracle RAC or DRCP. Keep a close on increase of data volume and need to archive old unwanted data from the tables. Get an agreement with your users on data retention policy to keep a check on volume. Regular monitoring with OEM, AWR reports, and Statspack will help you stay ahead of potential issues and maintain a healthy, performant database under varying loads.

Leave a comment